In September 2024, to comply with the SC General Appropriations Bill, the SC State Board of Education adopted a model cell phone ban policy, which all districts have to implement. This policy has now gone into effect, with mixed results. But the effects of the cell phone ban are not what this article is about. The State Board also released an 26-page “Administrator Toolkit” to assist in the transition to phone-free schools. Inexplicably, this document is publicly available, and can be found with a simple google search (or here). There are, what could be considered, ‘somewhat objectionable’ things in there, like an extremely dismissive attitude towards reasonable counter arguments for the ban, and almost complete lack of sources for scientific claims, but the most attention grabbing is this research infographic:
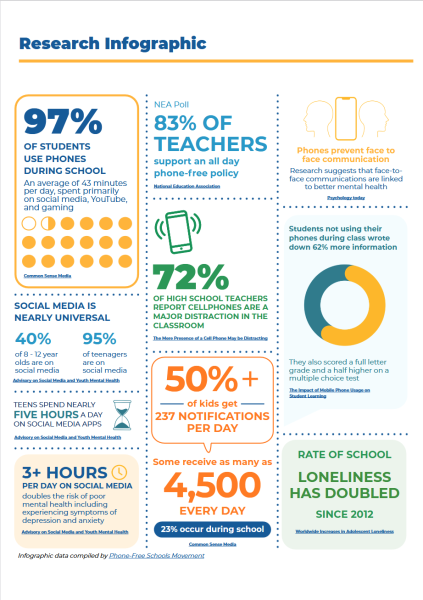
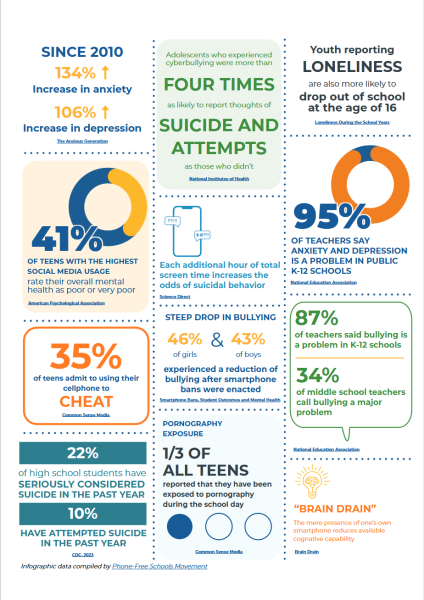
Read it in its entirety. It’s two pages of compelling, well researched data showing how a cell phone ban is necessary to help students, right? To quote the creed we all live by, the AMHS Honor Code, “Each Academic Magnet student is honor bound to refrain from stealing, lying, and cheating. … Lying is intentional misrepresentation of any form”. This series of articles is dedicated towards analyzing and evaluating each claim made on these two pages, and letting the reader decide: is this good evidence?
The first claim is pretty simple: it’s true. The source cited there (and in multiple other places) is this research report by Common Sense, a political advocacy group, who also operate Common Sense Media, which rates media for objectionable content. This study was conducted by tracking the phone usage of 203 11- to 17-year olds for one week. This is a rather small sample size, but the study is very credible, and has many interesting findings. And yes, 97% of those studied used their phones from 8 a.m. to 3 p.m. Monday through Friday, at a median of 43 minutes per day, with social media, Youtube, and gaming as the top 3 categories of apps used.
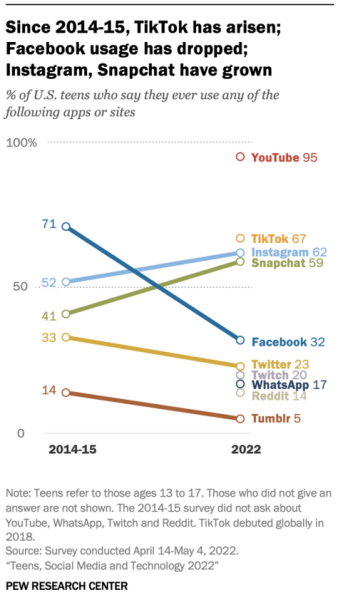
For the second claim, I have a question: what would you describe as “being on social media”? It’s technically a vague term. To be more specific, the criteria used here for “being on social media” is using Youtube. Ever. If you have ever watched a Youtube video, you are “on social media”. It’s easy to see how this happened: the infographic didn’t cite an original source. It cites the Executive Summary of The US Surgeon General’s Advisory on mental health. This is a compilation of actual research studies, not a study in itself. The first line of it is “Social media use among young people is nearly universal, with up to 95% of teenagers, and even 40% of children aged 8-12, on social media.1,2” The two sources cited are pretty credible, representative surveys of 1,316 and 1,306 teens and ‘tweens’ (students 8-12) respectively, the first by Pew Research Center and the second by Common Sense again. Here is where the 95% of teens comes from:
And here is where the 40% of 8-12 year olds comes from:
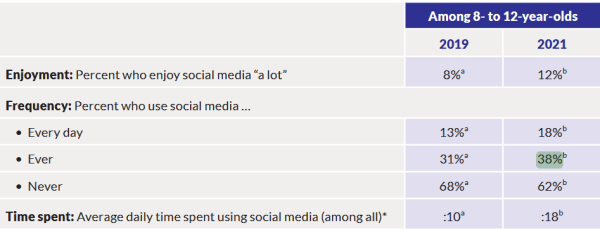
You may notice that the second chart does not actually include 40%. It does not. I do not know what the Advisory says 40% while the source says 38%. The numbers are very close, but it is strange that the Surgeon General’s Office got the wrong number.
The next claim is that “TEENS SPEND NEARLY FIVE HOURS ON SOCIAL MEDIA APPS”, and it cites the same Surgeon General’s Advisory. According to the Surgeon General’s Advisory: “a recent survey of teenagers showed that, on average, they spend 3.5 hours a day on social media.6” This number, notably, is not “FIVE HOURS”. This is obviously plain lying, right? At the bottom of both pages of the infographic data’s compilation is credited to the Phone-Free Schools Movement, with a link to their website. On their website, the PFSM advertises their Phone-Free Schools Administrator Toolkit. This is not publicly available, as it’s only for school administrators, and you have to request that they send you one. Inexplicably, they sent me one when I asked. Under the “Title (Role in school):” I put “student”. It is 25 pages long, and includes a 2-page research infographic, seen here:
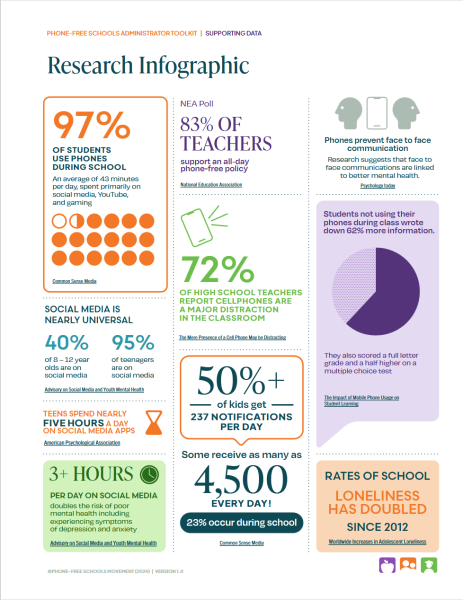
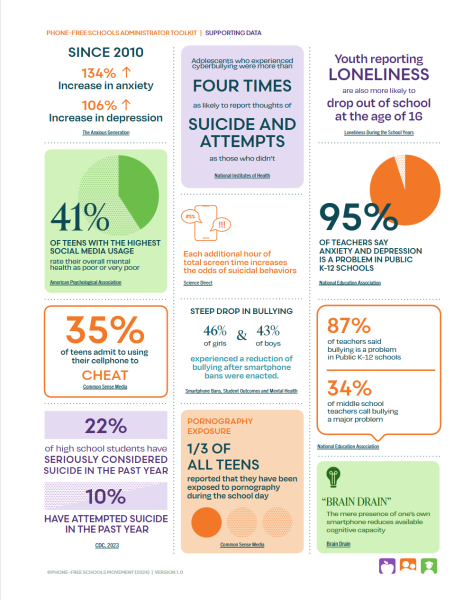
There are a few differences, however. The fonts are different, but that’s something very easy to change. The most interesting change is the sources for some of the claims are different. It’s only ever that a source from the original is missing on the State Board’s copy, never that the State Board added sources. This “five hour” claim is one such example. The original PFSM version cites this article by the APA Monitor. Note, not a study by the American Psychological Association, but an article in their magazine. The average in the article is 4.8 hours, but the infographic does say “nearly” 5 hours. The APA Monitor article cites two sources, the research report the data is from and a Gallup news article about it. We will come back to the specific study and who made it in a later article, but for now, how do we handle the discrepancy in the results from the study cited in the Surgeon General’s report and this study? The study that found the average (mean) to be 4.8 hours had a sample size of 1,591 (or 1,567, depending on whether you read the article of the study itself) teenagers. The study that found a mean of 3.5 hours(or 3.54 to be more specific) had a sample size of 23,238 teenagers, 22,431 of which put a valid answer to the question. The only other significant difference is that the 3.54 hour-finding study used the term “social networking sites”, while the other 4.8 hour-finding study used a more broad definition, that again includes sites like Youtube as ‘social media’.
The final claim analyzed in this article is also credited to the Surgeon General’s Advisory, but this time, the State Board actually cited the right source. And the study the Advisory cites is from a credible, peer-reviewed psychiatry journal. It is a very small and inconclusive study, and the authors plainly admit this. All their figures have a 95% Certainty Index, which means their results could be off by a lot, and they clearly call for research with a larger sample. Their sample is 6,595 adolescents, aged 12-15. They did find that adolescents who used social media for 3-6 hours a day had a relative risk ratio for ‘comorbid internalizing and externalizing problems’ of 3.15 compared to one of 1.39 for adolescents who use social media for less than 30 minutes. Claiming the risk “doubles” is arguably true, but the authors don’t ever claim something so definitive, and never claim that it can cause depression or anxiety symptoms. I’d categorize this claim as technically true, but very dubious, and with cherry picked data.
Part Two – next issue.


